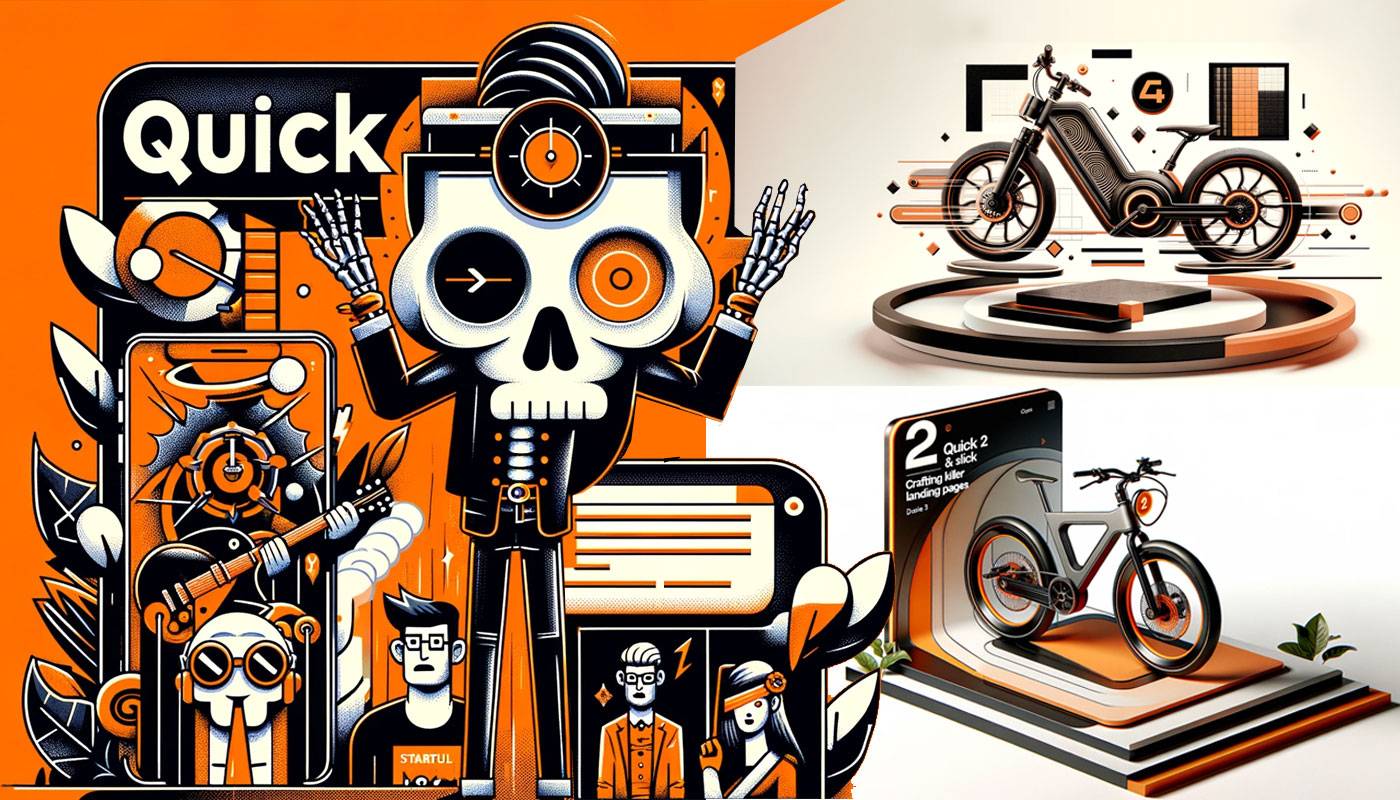
DALLE 3 Infographic Experiment: 28 Infographic Wins and Fails You Need to See
Welcome to the world of AI-generated infographics, where a single line in your prompt can open doors to visual marvels or lead you down a rabbit hole of design disasters. As an online content creator, you’re always on the hunt for that perfect infographic to spice up your social media. And guess what? DALLE 3 might just be your new best friend. Today, I’m diving into a fascinating experiment with DALLE 3, the AI-driven graphic genius. We’re not just dabbling here; we’re going full Sherlock Holmes on 28 different infographics to unearth what flies and what flops in the world of AI-generated visuals. And, oh, brace yourselves, because I’ve stumbled upon a game-changer – a single line in the prompt that turned my DALLE 3 outcomes from “meh” to “mind-blowing.” Intrigued? Let’s unravel this digital mystery together!  Understanding Infographics for Social Media First off, let’s talk about why infographics are the secret sauce of social media content. They are more than just pretty pictures; they are storytelling tools that break down complex information into digestible, shareable visuals. The right infographic can boost engagement, enhance your brand, and make your content stand out in the endless scroll of social media feeds. The DALLE 3 Experiment Begins Armed with DALLE 3, a tool that turns text into captivating visuals, I embarked on creating 28 different infographics. My aim? To figure out what works and what doesn’t in the realm of AI-generated graphics for social media. But here’s the kicker: not all spells (read: prompts) are created equal. I set out to create 28 different infographics, pushing DALLE 3 to its creative limits, and the results? Well, they were a mixed bag of nuts.
The Mediocre Beginnings
Presenting the Mediocre 18
Let’s start with the not-so-great. These 18 infographics were like that one friend who always shows up at the party but never dances. They were okay, but lacked the pizzazz. I tried everything from “make me an infographic about climate change” to “depict the evolution of smartphones.” The outcomes? A bit like a colorless rainbow – technically there, but missing the wow factor.
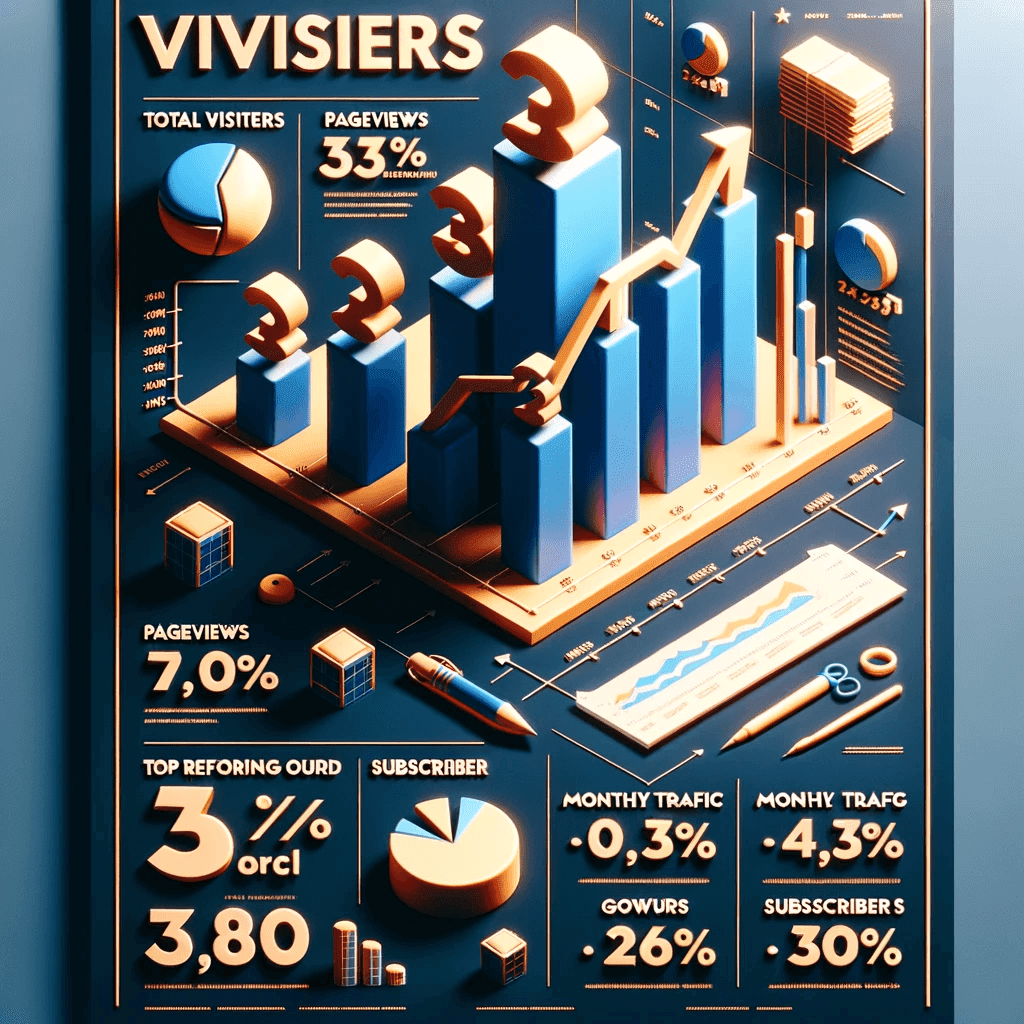
1. Statistical Data Infographic
It’s like giving your data a red carpet makeover – suddenly, those boring numbers are strutting their stuff like celebrities at an award show, ready to go viral.
DALLE 3 mediocre request: Create a visually engaging “10-Year Traffic Growth” infographic for a blogger to showcase their website’s progress. Place eye-catching titles on top of infographics.
2. Timeline Infographic
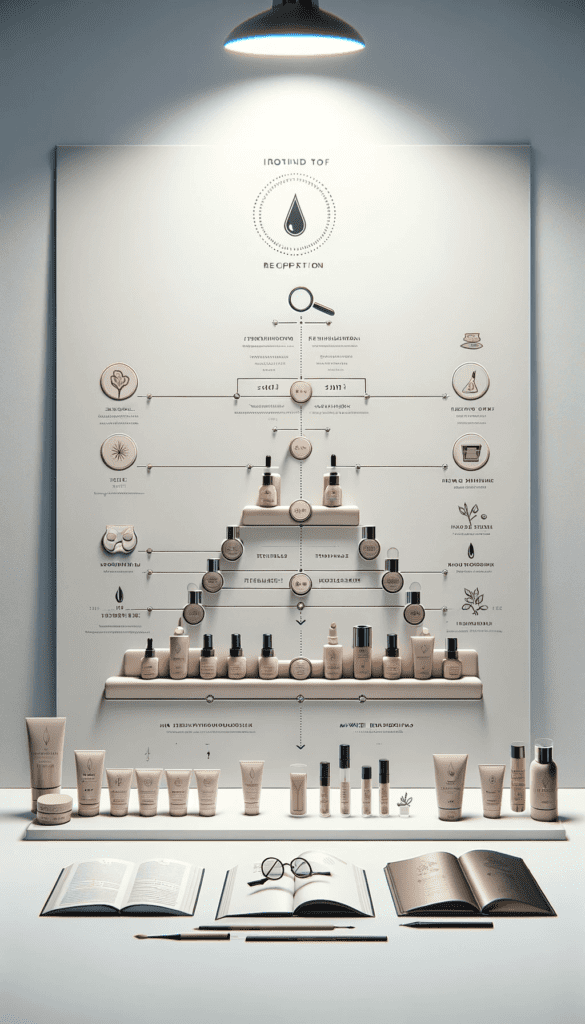
A timeline infographic is like a time capsule, showcasing your epic journey from humble beginnings to internet fame.
DALLE 3 mediocre request: Create a visually engaging vertical timeline infographic that chronicles the journey of a beauty product developed by a renowned beauty blogger. Ensure that the infographic not only highlights the blogger’s creative process but also reflects the growth and impact of the beauty product in the market.
3. Comparison Infographic
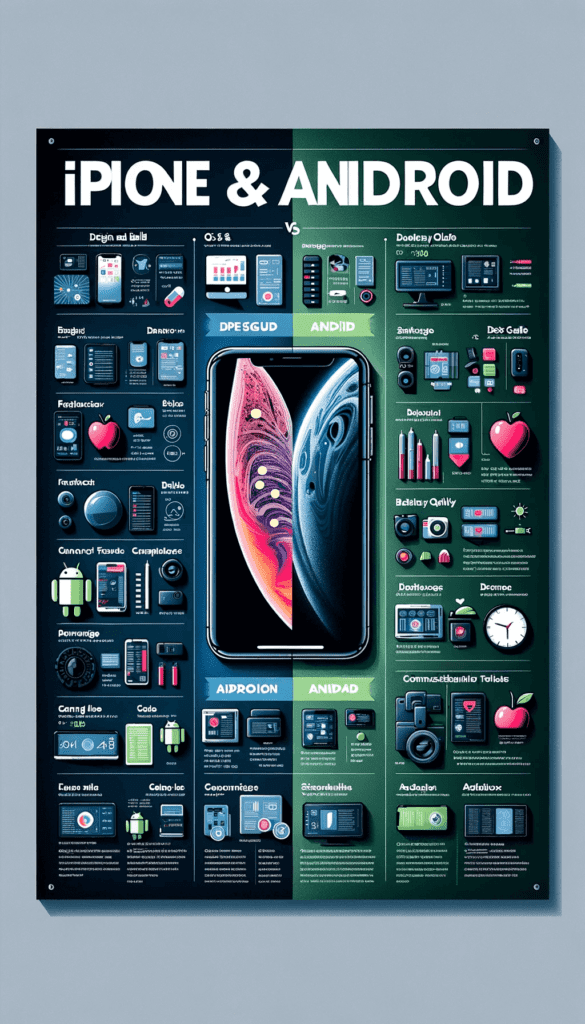
It’s like having a friendly debate where nobody gets offended. A comparison infographic lets you pit ideas, products, or stats against each other in a visual showdown that’s both informative and entertaining.
DALLE 3 mediocre request: Design a comparison infographic of features and specifications of the most recent iPhone and Android flagship smartphones. This infographic should include Design, Build, User Interface, Performance and Processor. Use clear, concise text, icons, and high-quality images to illustrate the contrasting and shared characteristics of these flagship smartphones.
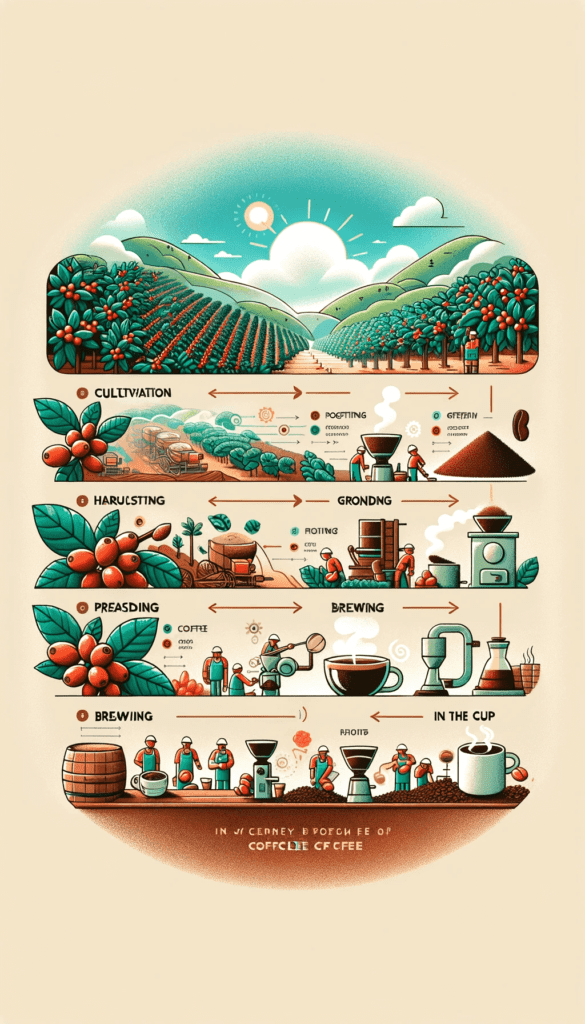
4. Process Flowchart Infographic
This is like a treasure map for understanding complex processes. Whether it’s the journey of a coffee bean or the inner workings of a tech gadget, a flowchart infographic unravels mysteries one step at a time
DALLE 3 mediocre request: Produce a process flowchart infographic illustrating the journey of a coffee bean from cultivation to the cup, with key steps and visual elements.
5. Geographical Infographic
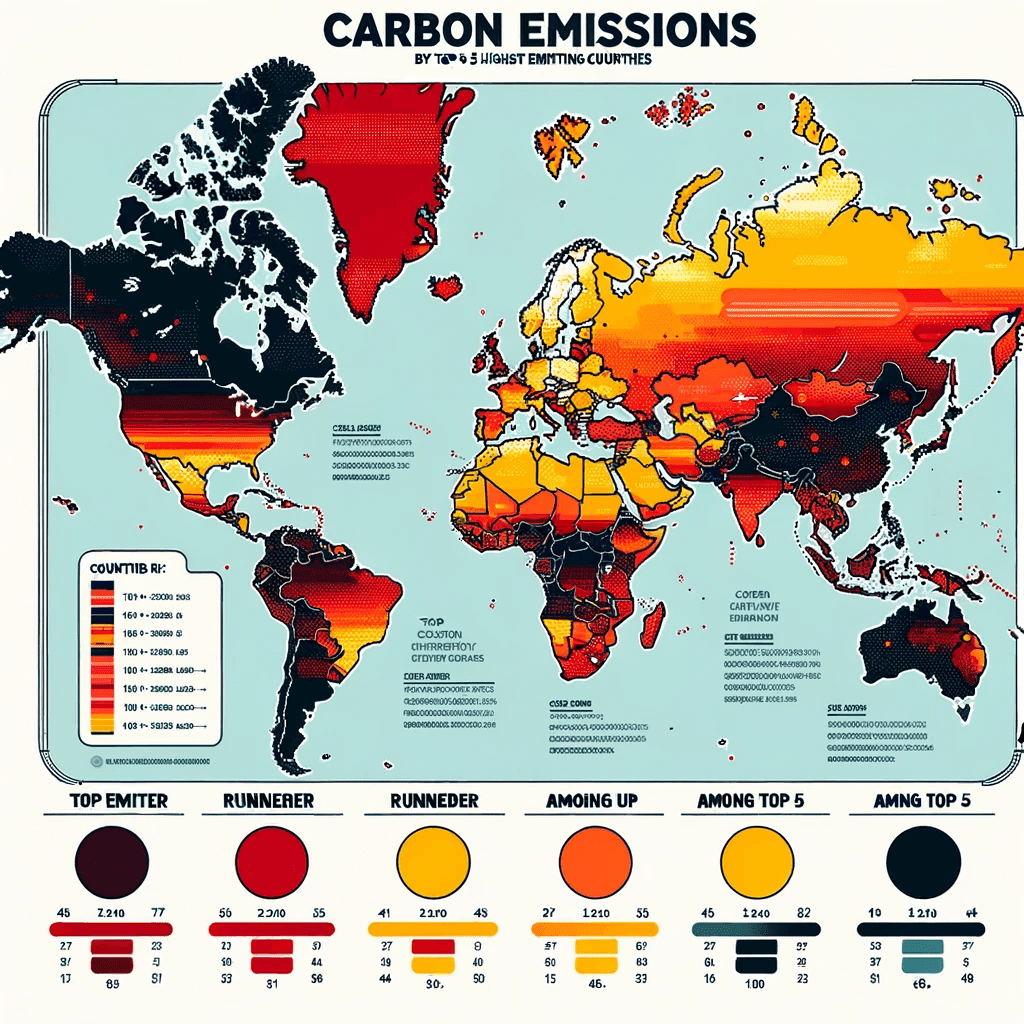
It’s like turning global issues into a neighborhood watch bulletin. With a geographical infographic, distant problems feel closer to home, sparking conversations and insights.
DALLE 3 mediocre request: Create a vertical geographical infographic displaying global carbon emissions by the top 5 countries, using 3 colour-coding to visualise variations. Mention the color code with an identity of what this color tells.
6. Product Features Infographic
Think of this as your product’s dating profile. It highlights all the best features and quirks, making it irresistible to potential buyers.
DALLE 3 mediocre request: Design an infographic highlighting the key features of a smartwatch, including health monitoring, battery life, and compatibility with devices.

7. Historical Infographic
Imagine if history lessons were less like lectures and more like scrolling through an engaging blog. Historical infographics can make the past pop with relevance and fun facts.
DALLE 3 mediocre request: Create a visually captivating historical infographic that traces the evolution of music trends over the last 2 years. Highlight key milestones. Use graphics and text to demonstrate how these trends have shaped the music landscape and influenced the online music industry.

8. How-To Infographic
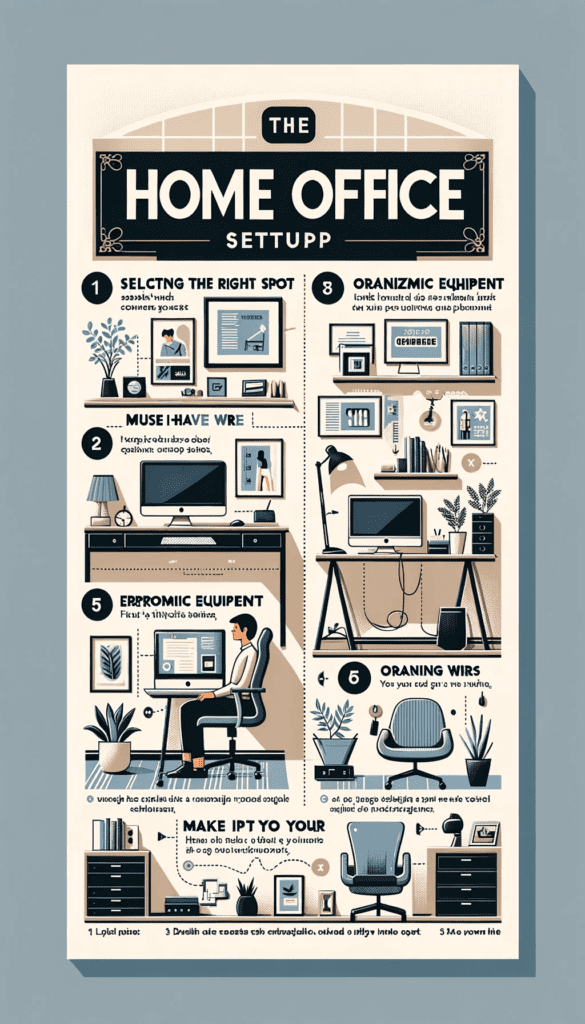
This is like having a wise guru guide you through the mysteries of ‘adulting’, from setting up a home office to fixing a leaky tap, all in visually appealing steps.
DALLE 3 mediocre request: Create a “how-to infographic” for setting up a home office, detailing the essential equipment, ergonomics, and step-by-step instructions.
9. Problem-Solution Infographic
It’s like a superhero comic where each panel shows you how to defeat everyday villains like a clogged drain or a flickering light bulb.
DALLE 3 mediocre request: Design an infographic illustrating common household problems (e.g., clogged drains) and their step-by-step solutions using clear visuals.

10. Customer Testimonial Infographic
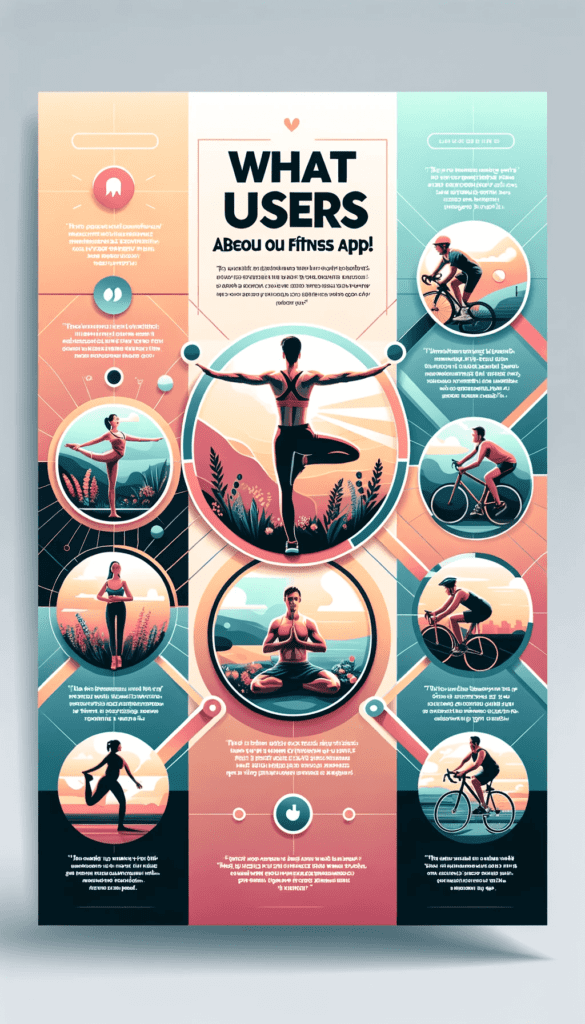
This is the online equivalent of a standing ovation from your satisfied customers. It’s the digital proof that you’re doing something right.
DALLE 3 mediocre request: Produce an infographic featuring customer testimonials for a fitness app, including user photos and positive feedback.
11. Top 10 List Infographic
These are like snackable bits of wisdom. Whether it’s sustainable living tips or tech hacks, a Top 10 list infographic packages insight in a fun, digestible format.
DALLE 3 mediocre request: Generate an infographic listing the top 10 eco-friendly practices for a sustainable lifestyle, with eye-catching visuals for each tip.

12. Industry Trends Infographic
It’s like having a crystal ball that shows you the future of your industry, turning complex market data into a visual feast of trends and forecasts.
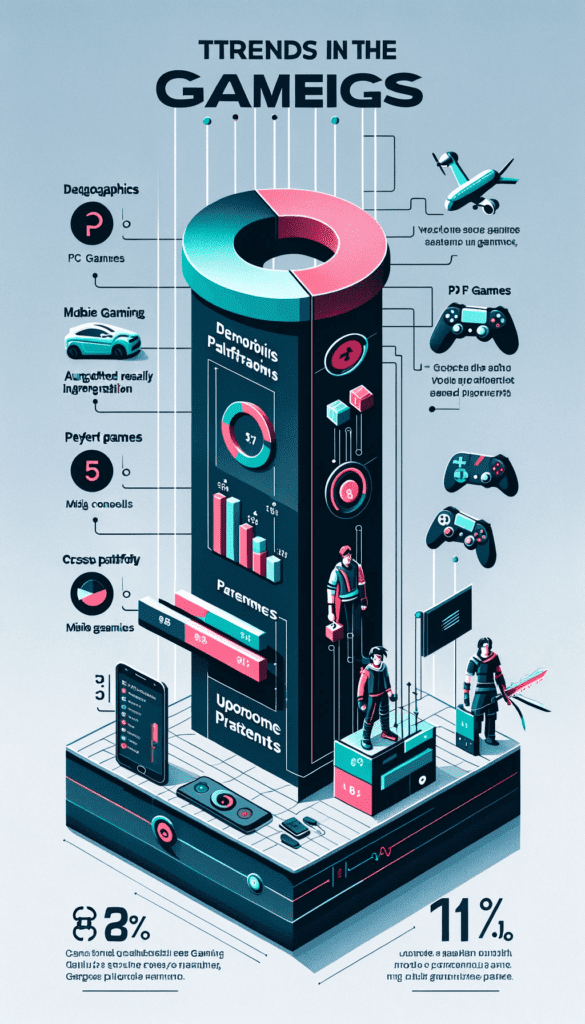
DALLE 3 mediocre request: Design an industry trends infographic for the gaming sector, presenting statistics on player demographics, gaming platforms, and emerging trends.
13. Storytelling Infographic
This turns your brand story into a page-turner. It’s like condensing a blockbuster movie into a single, compelling visual narrative.
DALLE 3 mediocre request: Create a storytelling infographic to illustrate the founding story of a successful tech startup, using visuals and concise text.

14. Quote Infographic
It’s like having a wall of wisdom in your pocket. A quote infographic turns powerful words into visual masterpieces, making inspiration both beautiful and shareable.
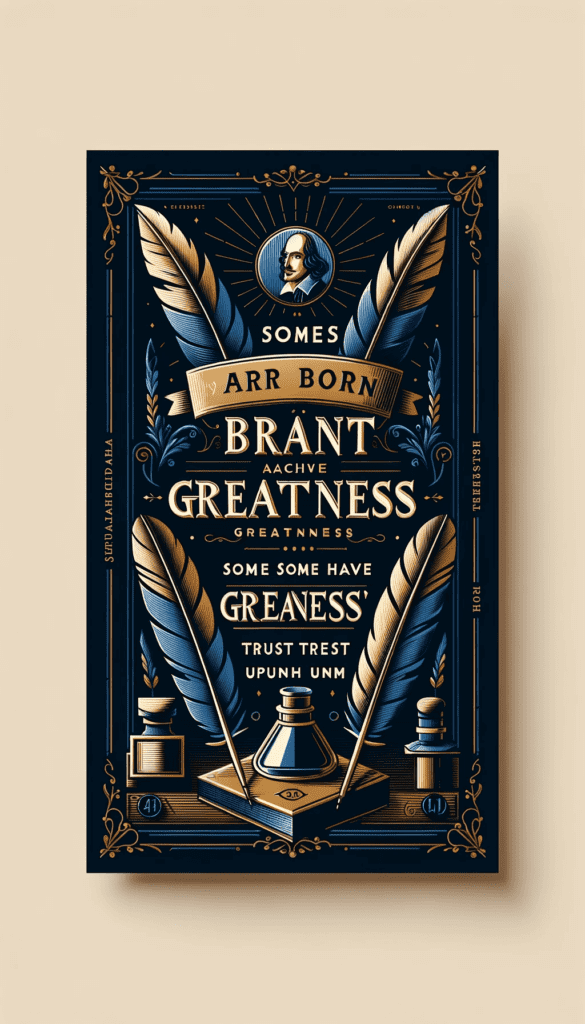
DALLE 3 mediocre request: Produce an eye-catching quote infographic featuring an inspiring leadership quote by Nelson Mandela, with elegant typography and visuals.
15. Case Study Infographic
This is like a victory lap in visual form, showcasing your successes and lessons in a story that’s both informative and inspiring.
DALLE 3 mediocre request: Design a case study infographic outlining the growth and success story of a small online business, including challenges, strategies, and outcomes.

16. Recipe Infographic
It’s like having a friendly chef right there in your kitchen, guiding you through each step with visual cues and mouth-watering graphics.
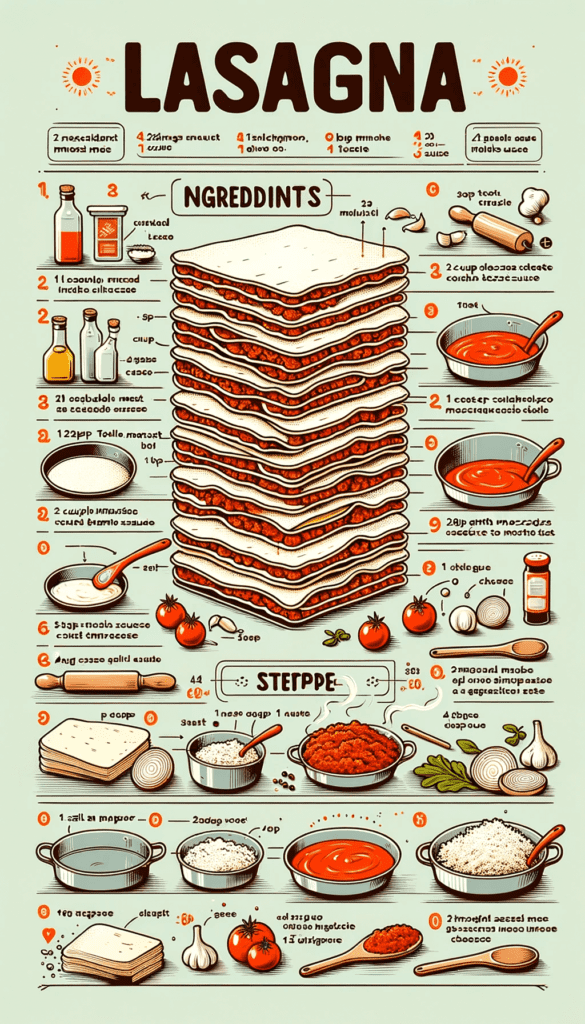
DALLE 3 mediocre request: Generate a recipe infographic for a classic lasagna dish, including ingredients, step-by-step cooking instructions, and delicious visuals.
17. Event Promotion Infographic
This is your event’s hype person, turning what could be a bland announcement into a must-attend extravaganza, complete with all the whistles and bells.
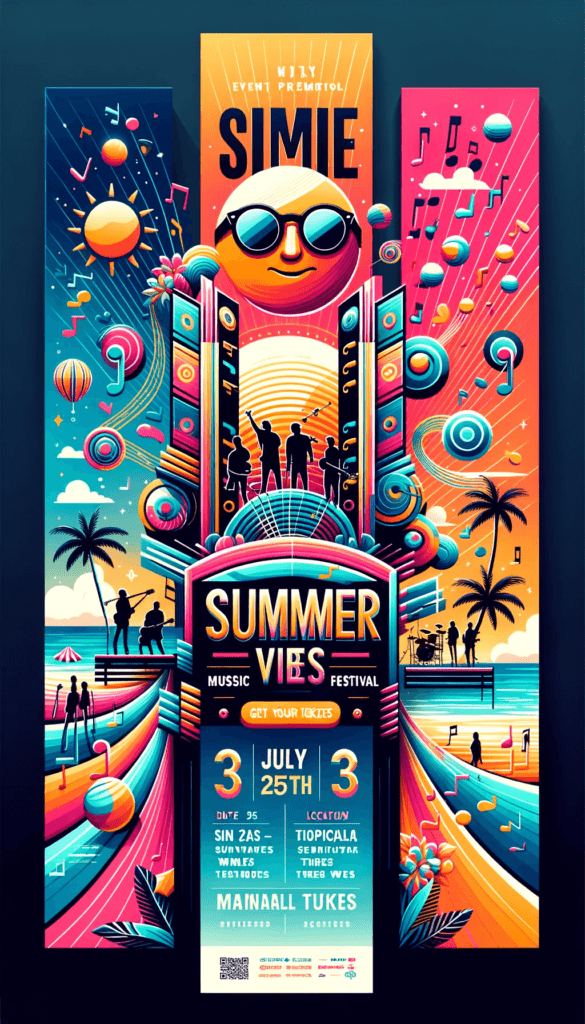
DALLE 3 mediocre request: Create an event promotion infographic for a summer music festival, including event details, artist lineup, and vibrant visuals.
18. Quiz or Survey Infographic
It’s like playing a game of trivia with your audience. These infographics turn mundane surveys and quizzes into engaging, interactive experiences.
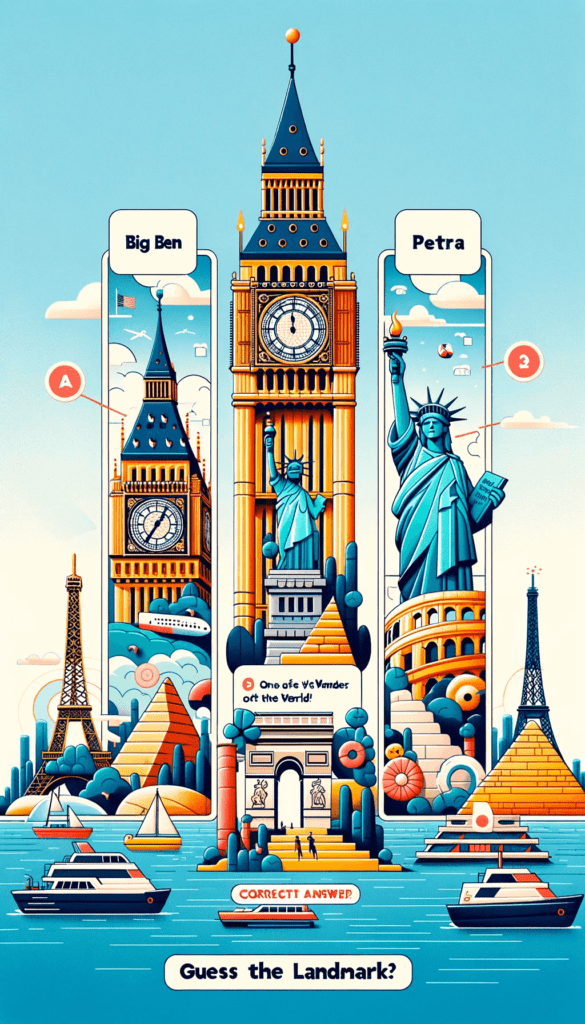
DALLE 3 mediocre request: Design a quiz infographic on ‘Famous Landmarks Around the World,’ with questions and answer choices in an engaging visual format.
The Usual five
Showcasing the Usual 5
Then came the usual suspects. These five were a step up, like ordering a latte and actually getting a latte. They were closer to what I wanted, but still, something was missing. They were the kind of infographics you’d nod at but wouldn’t save on your phone. 
DALLE 3 prompt: Create an infographic with a sleek, modern, and premium graphic style, highlighting the comparison between visual content and text-only content. The top half should feature a stylized human brain lit up with vibrant colors and connected to icons of a camera, video play button, and paintings, symbolizing the stimulation of visual content. The bottom half shows another brain with muted colors connected to icons of a book, document, and alphabet letters, representing text-only content. The contrast should be evident through the use of color saturation and brightness to depict the brain’s different responses. No titles or wording should be included, and the design should be vertically aligned.

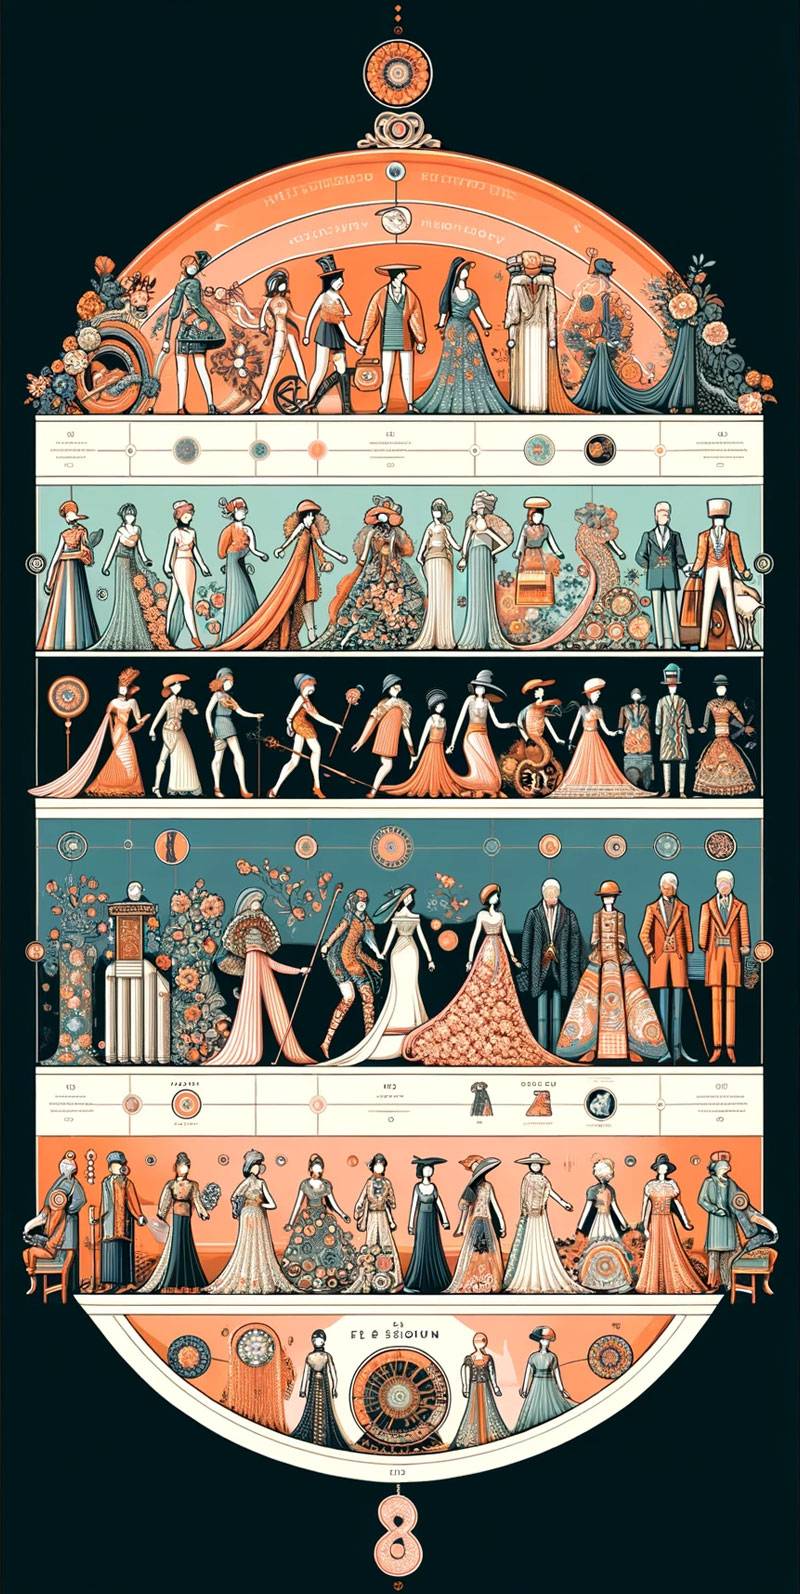
DALLE 3 prompt: Design the ‘Fashion Through the Decades’ infographic, focusing on a realistic and visually stunning style inspired by trending infographics on Bing. Depict iconic fashion styles from the 1920s to the 2020s, starting from the top and moving downwards. Avoid numbers and text, and instead use a harmonious color scheme and high-detail illustrations to showcase the fashion evolution. The transition between decades should be seamless and visually engaging, highlighting the distinct fashion trends of each era with lifelike accuracy and beauty.
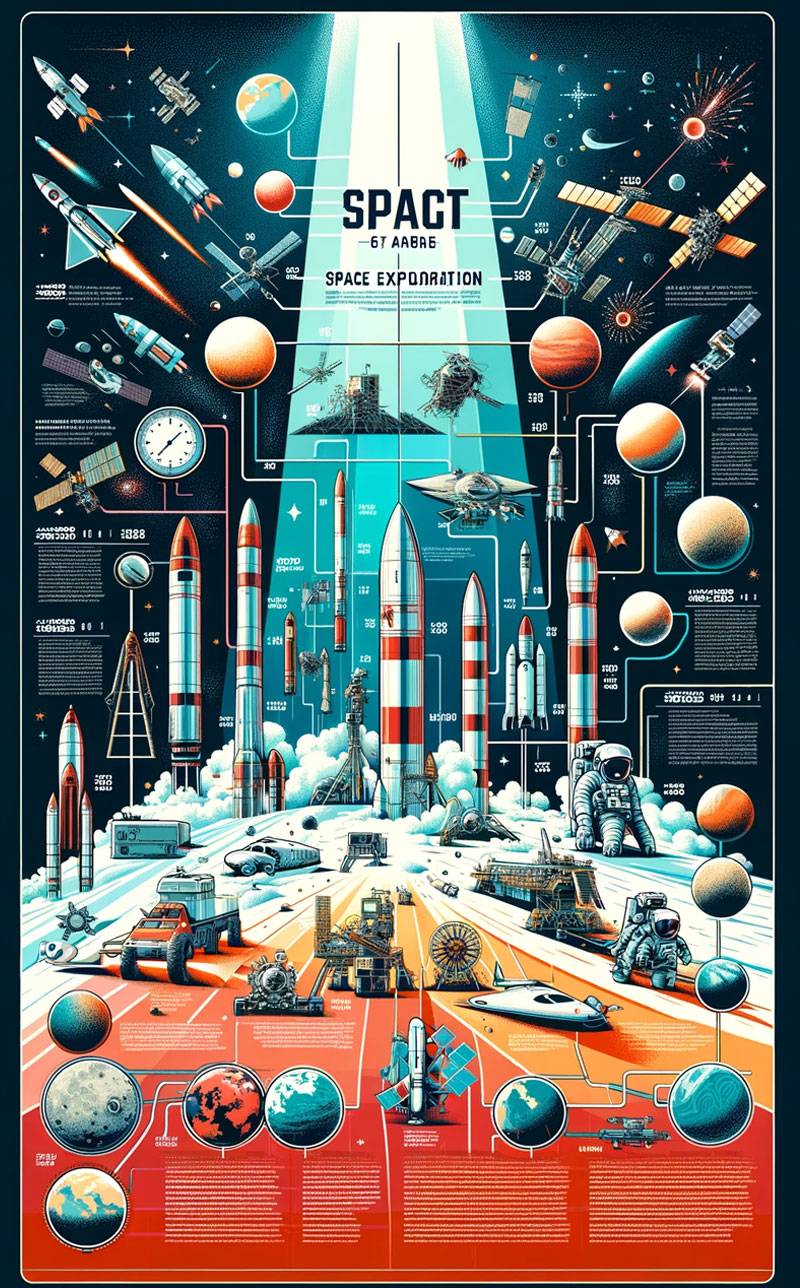
DALLE 3 prompt: Design an infographic for ‘Space Exploration Milestones,’ highlighting key events and missions in the history of space exploration. The graphic should start with the earliest milestones at the top, progressing to the most recent achievements at the bottom. Use a vibrant and engaging color palette with iconic imagery for each milestone, such as rockets, satellites, and planets. The design should be visually striking and intuitive, clearly depicting the evolution of space exploration without using any text or numbers, in a vertical layout.
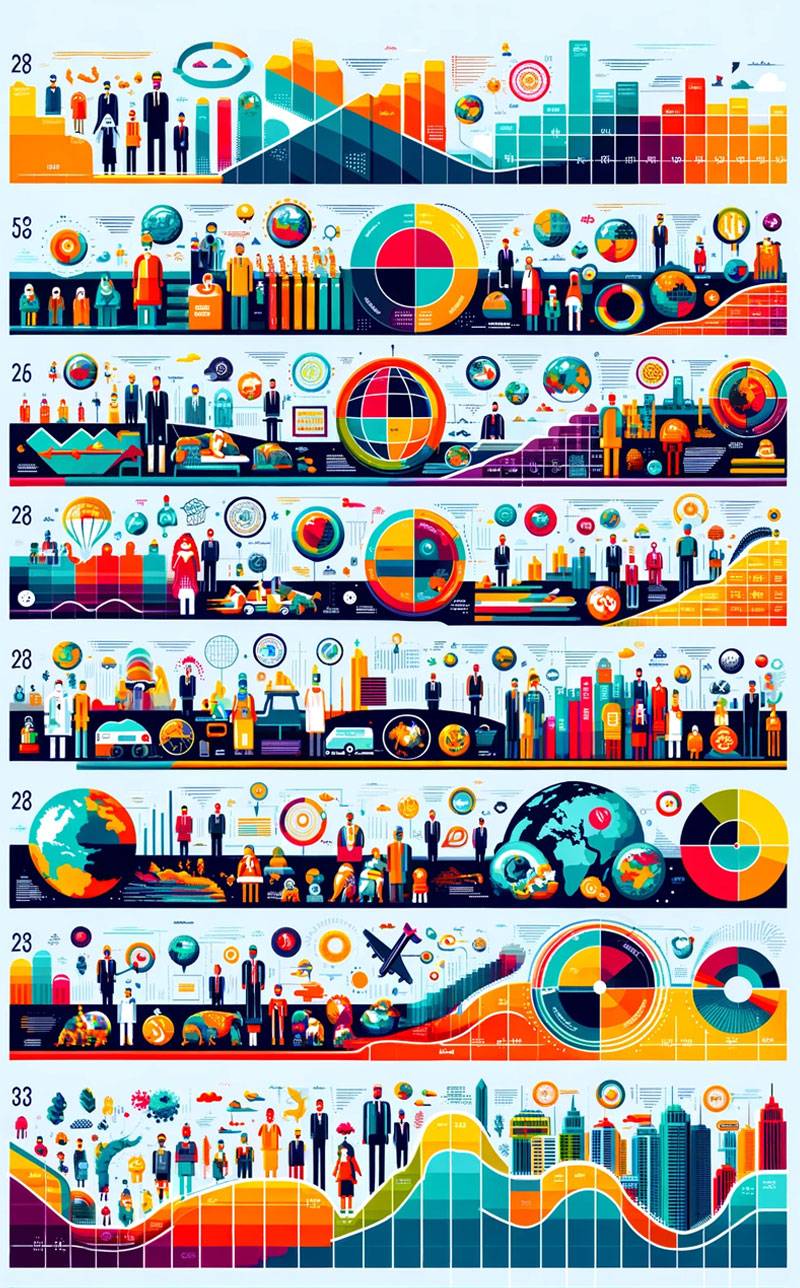
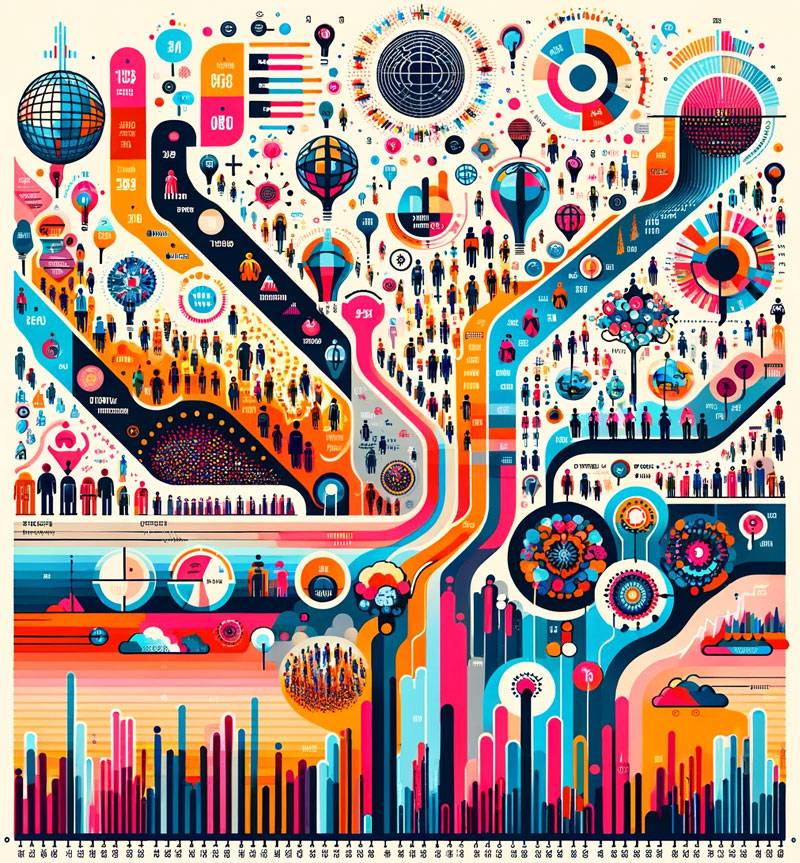
DALLE 3 prompt: Create a visually impactful infographic for ‘Changing Global Population Dynamics.’ The graphic should depict the growth and shifts in the global population over the decades, starting with the earliest data at the top and moving to the most recent at the bottom. Use a diverse and vibrant color palette, with each era represented by a unique and engaging symbol or illustration, such as demographic icons and population graphs. The infographic should be intuitive and visually striking, effectively showing the changes in global population without using any text or numbers, in a vertical layout.
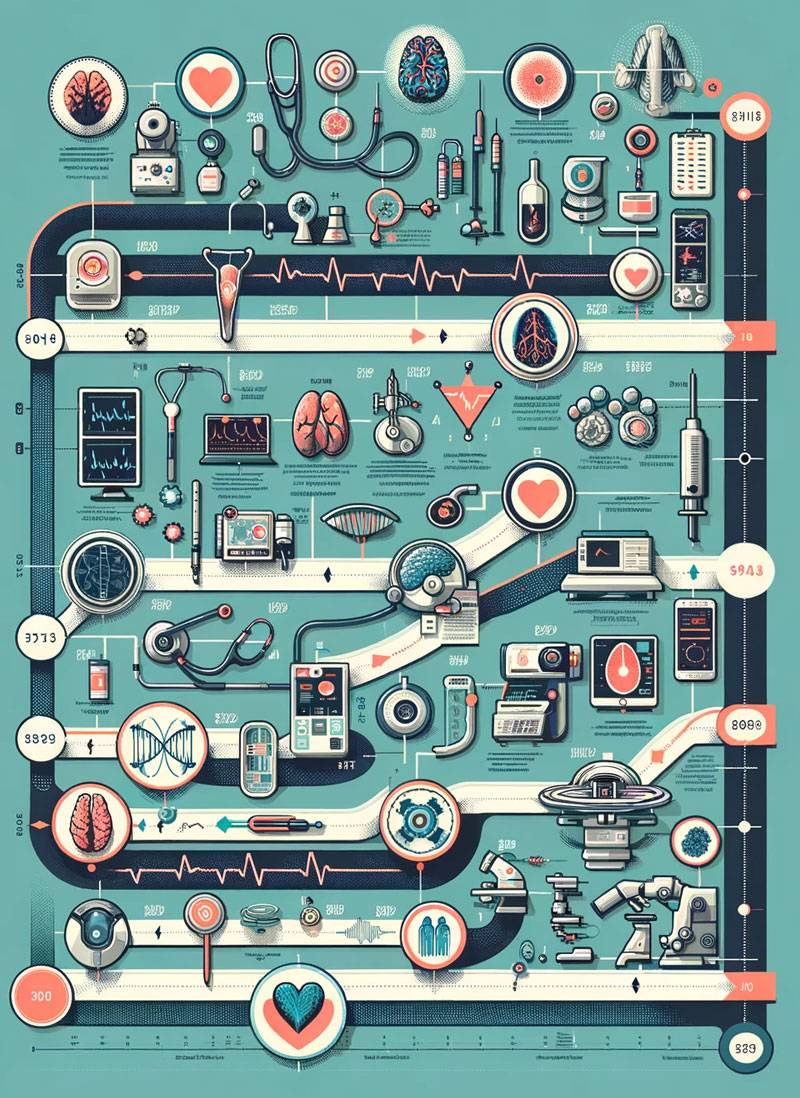
DALLE 3 prompt: Design an infographic for ‘Advancements in Medical Technology,’ illustrating key medical advancements over time. The graphic should start with the earliest developments at the top, leading to the most recent innovations at the bottom. Use a clean and modern color palette, with each advancement represented by a distinct and stylized icon or illustration, like stethoscopes, microscopes, and MRI machines. The infographic should be visually engaging and intuitive, clearly showing the progression of medical technology without any text or numbers, in a vertical layout.
The Game-Changing five: The Visual Powerhouses
The Transformed 5: A Symphony of Style
Step into the realm of the extraordinary with the transformed five – where each infographic is a visual concert, a blend of style and substance that captivates at first glance. Here, DALLE 3 didn’t just create; it performed. Each piece stands out with a consistent cool style, a symphony of vibrant colors and crystal-clear data, orchestrated perfectly to capture attention and clicks. These aren’t just infographics; they’re visual magnets, designed not for a casual read but for immediate action – THE CLICK! They are the kind that thrives on platforms like LinkedIn and Pinterest, where the sole purpose of an image is to result in a click. With these transformed infographics, the game changed – it was no longer about merely conveying information but doing so in a way that’s irresistibly clickable. This shift, all sparked by that one masterful prompt, demonstrates how the right words can transform data into a visual feast, beckoning viewers to stop, stare, and engage. Title: The Growth of Social Media Platforms 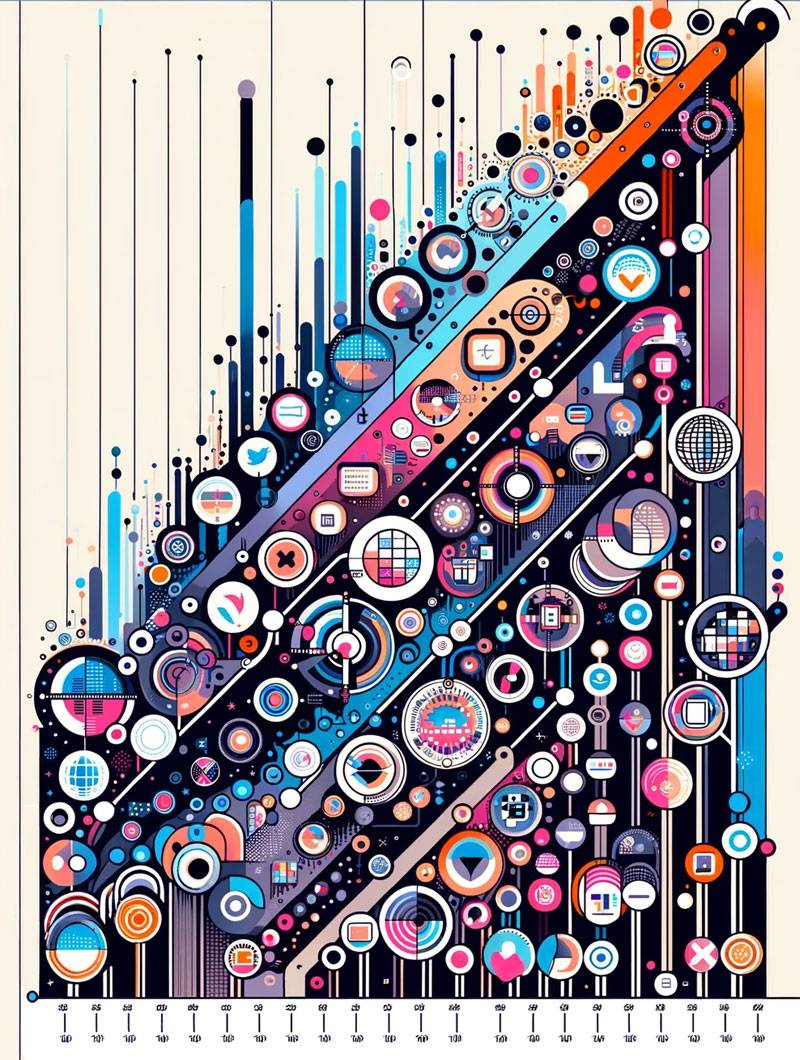 Get DALLE 3 prompt here. Title: Advancements in Medical Technology
  Get DALLE 3 prompt here. Title: World’s Most Visited Tourist Attractions
 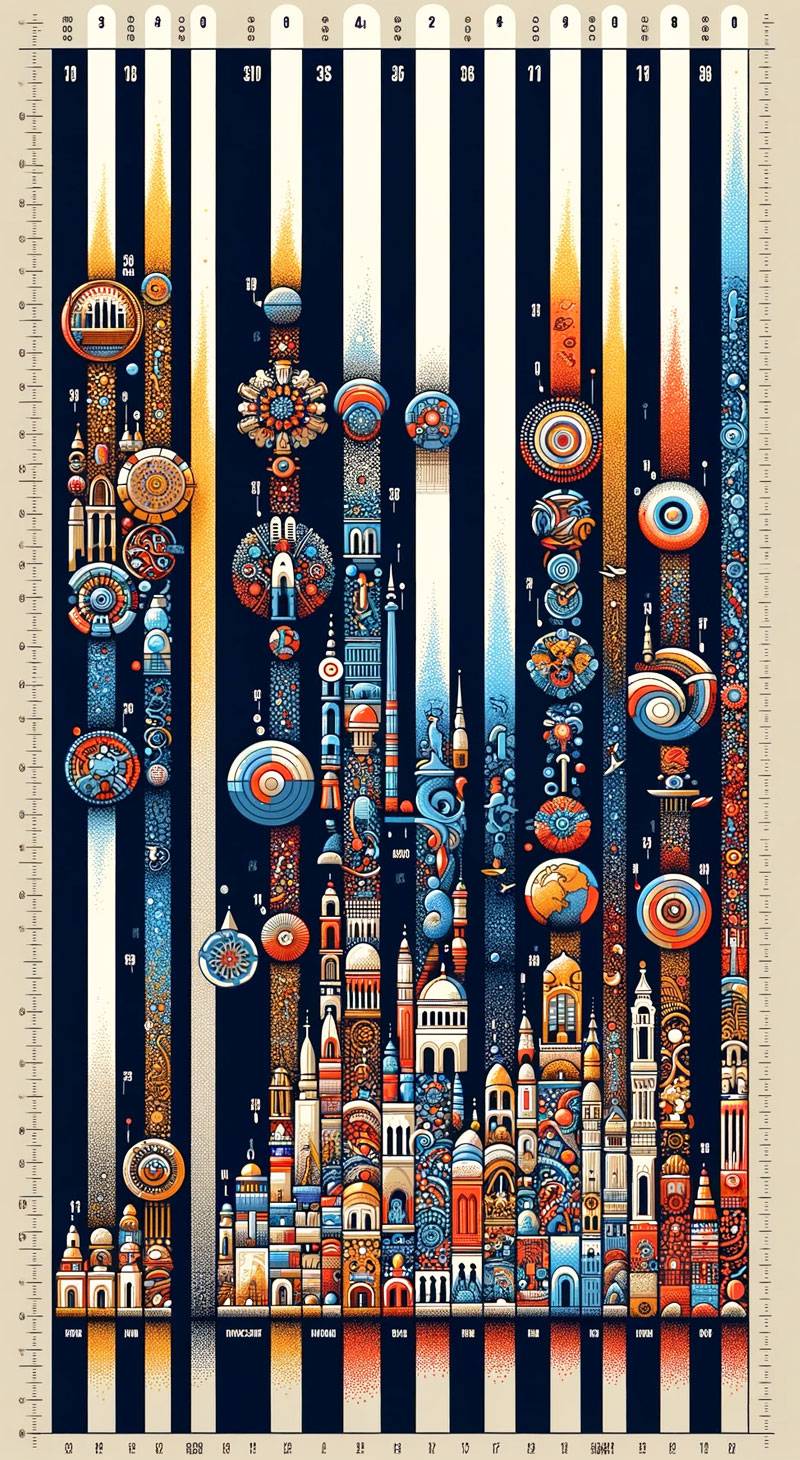 Get DALLE 3 prompt here. Title: Fashion styles across eras
  Get DALLE 3 prompt here. Title: Changing Global Population Dynamics
  Get DALLE 3 prompt here.
Lessons Learned and Tips
Here’s the gold dust from my experiment: the prompt is your wand, wield it wisely. Be specific, be clear, and don’t be afraid to experiment. DALLE 3 is powerful, but it needs the right directions to create that masterpiece infographic you’re after.
The Game-Changing Line
Now, let’s dive into that groundbreaking moment in my DALLE 3 experiment – the discovery of a game-changing line. Picture this: Amidst my trials with DALLE 3, I stumbled upon not just a tweaked prompt, but something far more powerful – a strategy to creating captivating infographics in seconds. This wasn’t just a minor tweak in the way I used DALLE 3; it was a monumental shift. The quality of the infographics transformed dramatically. We’re talking about a leap from ‘pretty decent’ to ‘stop-and-stare amazing’. Now you can access it too! Via our fine-tuned GPT that produces stunning infographics effortlessly. And here’s the kicker – this isn’t some exclusive, behind-the-scenes tool; it’s accessible for your use HERE. You now have the chance to harness this power for your projects. Imagine creating the most visually striking infographics tailored perfectly to your needs, and all of this, in a blink of an eye. Tip #1 to #16: Nailing the Basics
- Start with a clear concept. Your infographic should have a focused theme or idea.
- Keep it simple. Overcomplicating your prompt can lead to cluttered results.
- Avoid text and numbers in your prompts. DALLE 3 can get a bit wonky with these.
- Use specific color schemes. This can help maintain brand consistency.
- Define the infographic type. Are you creating a comparison, process, or statistical infographic?
- Incorporate relevant keywords. This helps DALLE 3 understand the context better.
- Experiment with different styles. Find what resonates with your audience.
- Be mindful of your audience. Tailor your infographic to their preferences and understanding level.
- Request for high contrast. This makes your infographic pop on small screens.
- Ask for a clean layout. Clutter is the enemy of engagement.
- Set the right tone. Whether it’s professional, playful, or informative, make sure it aligns with your brand.
- Use analogies in your prompts. This can lead to more creative results.
- Balance visuals with space. A cramped infographic is hard to follow.
- Request specific elements. If you need charts or graphs, mention it in your prompt.
- Ask for mobile-friendly designs. Most social media browsing is done on mobile.
- Use descriptive adjectives. They guide the AI to your desired aesthetic.
Tip #17 to #32: Advanced Prompting Techniques
- Layer your prompts. Start broad, then refine with additional prompts.
- Incorporate trending topics. Make your infographic timely and relevant.
- Use metaphors for abstract concepts. DALLE 3 can interpret these creatively.
- Avoid ambiguity. Be as clear as possible about what you want.
- Request specific imagery. If your topic is about finance, mention stocks or charts.
- Mix and match styles. Combine elements from different genres for a unique look.
- Be specific about the infographic’s purpose. Is it educational, promotional, or entertaining?
- Test different prompt lengths. Sometimes less is more, and other times, more is needed.
- Align with current design trends. Keep your infographics modern and fresh.
- Incorporate user-generated content ideas. This adds a personal touch.
- Ask for variations. This gives you multiple options to choose from.
- Be playful with concepts. Humor and wit can make your infographic more engaging.
- Request data visualization. If you’re dealing with numbers, make them visually appealing.
- Experiment with abstract concepts. Sometimes the best results come from unexpected prompts.
- Adjust your approach based on results. Use your successes and failures to refine future prompts.
- Remember the ‘less is more’ principle. Overly detailed prompts can lead to confusing results.
Conclusion
So what did I learn from this DALLE 3 escapade? Well, it’s not just about throwing words into the AI blender and hoping for a Michelin-star infographic. It’s like texting – the better your emoji game, the better the reaction. It’s all in the ask! So, go on, flex those typing muscles. Be bold, be brave, and maybe a little cheeky with your prompts. Watch as your infographics go from ‘just another email attachment’ to ‘wallpaper-worthy masterpieces’!


